Wednesday, June 3, 2009

Whats the Better Investment Now - Stocks or Bonds?


With the stock market up nearly 30% from it's lows only 3 months ago, many investors are speculating that it may now be time to consider investing in Bonds, which could pay off better then stocks int he long run. That's at least what some experts are saying. Me, on the other hand, disagree.


Bonds:
Bonds are still yielding extremely low rates of return compared to the past. The 10 year Treasury is paying just about 3.6%. That's not terrible, but you have to consider that inflation could easily reach 3.6% within the next year, and likely will go a bit higher than that. If inflation strikes like many experts think, we could see 10 year Treasuries paying over 6% easily, meaning those lowly 3.6% bonds you purchase today will be worth about 60% then. I, in fact, do like some of the more risky corporate bonds, where you can get a return as high as 10% on companies which really are not in that bad shape.

Stocks

Right Now, even though the market is up 30% from it's lows, I am still a stock guy. Although I do own some bonds, I believe that the stockmarket is the place to be. Why in the world would you buy a 3.6% Treasury bond that is locked in for 10 years, when you can buy a stock like Verizon (VZ) which has a 6.25% dividend, you can sell whenever you like, and will likely increase it's share price over the long run with or without inflation. If you are looking for the stable return of bonds, then buy some of the blue chip dividend stocks like Intel, BP, Pfizer, Bristol Myers Squibb, Altria, etc. You will get a pretty reliable stable return higher than 3.6% plus have the stock price gain to look forward to as well.

Conclusion:
Stocks are still an excellent buy. With the economy picking up finally, most dividend stocks which have yet to cut their dividends will likely be safe from here on out.

Tuesday, June 2, 2009

Historic PE Ratios Compared to Interest Rates


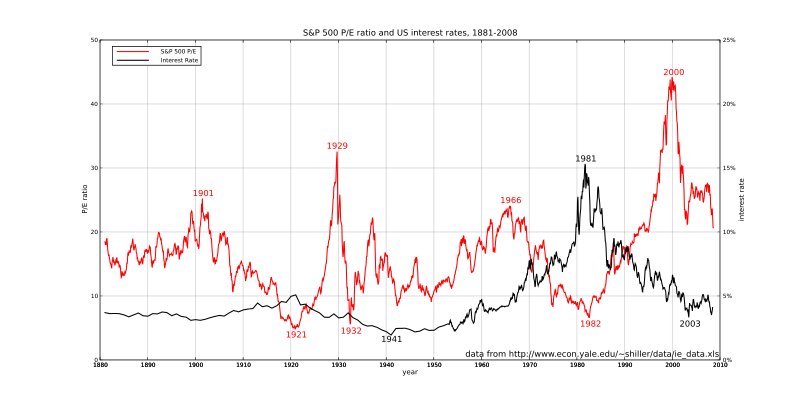
I don't have all that much news to bring to you all today so I thought I'd take a look at another chart. Below is graph of Interest rates vs the PE Ratios (Price to earning ratios of the S & P 500) over the last 120 years in the United States:


Like I said before I love looking at graphs and charts because they can tell you more than an entire 10 page essay could in just a few seconds. As you can see, we are currently at a pretty high average PE ratio, but having said this, it is so much lower then it was just a few years ago. You also must account for the fact that there is now optimism in growth, so a higher than average PE ratio is not all that bad. The current graph, however, leads me to believe that we may see a leveling off of the Dow at around 9000-9200, where it may stay and hover around for some time until better earning reports come out.

For those of you not familiar with PE ratios, it basically is the return a stock has over a year. If you have a PE ratio of 20, that means it will take the company 20 years to make a profit equal to it's current share price. Divide 100 by the PE ratio and you will get the rate of return the company is making. For instance 100/20 = 5, which means investing in the stock will provide a 5% annual return. Looking at the chart above you can see that in 1982, PE ratios were low, while interest rates were high. Is is because people could make a ton of interest just buying bonds, so why invest into stocks that have a yield lower then bonds do, at greater risk.

It should be interesting to see, how inflation could hamper the recovery of the US stock market should it go up by more then a few basis points.

Monday, June 1, 2009

General Motors Bankrupt, Household Income Up


What a start to the day! Not only is it the first day of the second half of the year, but we are also getting all kinds of news and seeing movement in various investments.

GM Bankruptcy
General Motors today filed for bankruptcy protection. The United states government, yes us tax payers, will own about 60% of the US auto maker. Although a bankruptcy is far from good news, the markets were expecting it, and now that it has happened, it's out of the way, and any uncertainty is finally lifted.


Gold Approaches $1000 Mark

For the third time in the last 18 months or so, Gold has approached the $1000 mark. Helped by rising energy costs and a lower dollar, prices could soar past that mark. Many experts predict that if Gold can hold above $1000 for a third time, and make even the slightest move above it, we could be headed for a Gold rally not seen in years.

Technology Booming
The E3 Video Game conference is today, which means we will likely see some new technological advances in the Video Game market. This along with the Fact that Microsoft's new search engine, Bing, has launched this morning, and Google announced a possible game changer of a communications setup, called Google Wave, last week, the tech sector is on a role. Expect this to continue into next weeks Apple conference.

Personal Income Rose
For the month of April, Personal income rose an unexpected 0.5%. This was well above the drop of 0.2% most economists were predicting. Yet another signal things are finally turning around. As a side note though, the saving's rate increased, meaning consumption decreased just a bit.

The rest of this week should continue to be interesting. Back in a March post I predicted that the Dow will be in the 9000-9500 range by August. That is actually looking very possible right now.

Friday, May 29, 2009

Next Weeks Market News Makers - Unemployment to 9.2%


It's Friday again, so that means we look at what one can expect from the markets next week. This week has been pretty good overall. We saw today that the first quarter GDP decline was only 5.7% instead of the initially thought 6.1% decline. Experts also predict a much flatter decline for the 2nd quarter and finally an increase in GDP for Quarter 3. By the forth quarter, experts predict a 1.8% increase in GDP. So what on tap for next week? Here is the economic Calendar for the first week in June, 2009:

- Jun 1 8:30 AM Personal Income
- Jun 1 8:30 AM Personal Spending
- Jun 1 10:00 AM Construction Spending
- Jun 1 10:00 AM ISM Index
- Jun 2 10:00 AM Pending Home Sales
- Jun 2 2:00 PM Auto Sales
- Jun 2 2:00 PM Truck Sales
- Jun 3 8:15 AM ADP Employment Change
- Jun 3 10:00 AM Factory Orders
- Jun 3 10:00 AM ISM Services
- Jun 3 10:30 AM Crude Inventories
- Jun 3 10:35 AM Crude Inventories
- Jun 4 8:30 AM Initial Claims 05/30
- Jun 4 8:30 AM Productivity-Rev. Q1
- Jun 4 8:30 AM Unit Labor Costs Q1
- Jun 5 8:30 AM Average Workweek
- Jun 5 8:30 AM Hourly Earnings
- Jun 5 8:30 AM Nonfarm Payrolls
- Jun 5 8:30 AM Unemployment Rate
- Jun 5 2:00 PM Consumer Credit

The data that I will be looking at that I think could move the markets quite a bit are, the construction spending data, which could signal a turnaround in the housing market, as well as the Unemployment data. The Unemployment rate was at 8.9% at the end of April, and will likely increase to about 9.2% for the end of May. Consumer credit is also another big piece of info we will get by Friday, and should let us know in a bit more detail, just how backed up the credit markets are. Another thing to note are the forex markets in which the dollar has continued to fall this week, leading Gold and other commodities to have a nice run.

Thursday, May 28, 2009

Unemployment Rates for the Last 20 Years


Today we got word that the the pace of Unemployment for the month decreased a bit. That's not that great news considering it still increased by more then 600,000 individuals. Anyway, On this Thursday I thought we'd have a look at the US unemployment rate for the last 20 years. I like graphs and charts, because like they say "a picture is worth a thousand words." Graphs tell multiple stories and quickly allow you to visualize just how bad things may be right now:


Looking at the chart above, which is about 45 days old, it is really daunting how fast the unemployment rate rose. Much faster then any time in the last 20 years, or last 60 years for that matter. Another thing sticks out is year and a half from 2007-2008 where the unemployment rate was under 4%. At the time we didn't realize how good we had it. Now, as the rate approaches 10%, probably sometime by the year's end, we look back just 18 months and wish we were even close to those rates. The good thing though is that we likely won't go much higher then 10%, and soon after will begin adding jobs. Will we see a rate of 3.5% like we did 2 years ago, anytime soon? I doubt it, but by late 2011 I wouldn't be surprised seeing the rate in the 5-6% range, which isn't half bad.

Wednesday, May 27, 2009

Recession over By 2nd Half of this Year


I know my blog is always pretty optimistic about the economy, so for those of you who are pessimists, you may want to skip this post. Anyway, In past entries I had predicted a bottom to the market when it hit 6400, I predicted that unemployment will begin decreasing in early 2010, and the recession would be over by the second half of this year. Well, it looks like some of the experts agree.

Recession over?
A panel of 45 of the nations leading economists, have predicted that the 2nd Quarter of this year, the one we are in now, will still see negative economic growth. However, the last 2 quarters of this year, June onward, will see positive growth from the United States economy. What does that mean? The recession's end is in sight. A full 75% of the economists polled felt the 3rd quarter of this year would see positive GDP growth. Don't get too excited though. The majority of economists polled felt that although growth will finally make it's presence, the rate of growth will be small, and well below the average growth rate of the US economy. The growth rate however will be at about average by the time 2010 rolls around.

Job Predictions

The Panel of economist's average forecasted unemployment rate by the end of 2009 is 9.8%. This is quite a high number, but in 18 months, by the end of 2010, this rate will have dropped to 9.3% and continue falling at a faster pace thereafter for several years. Unemployment is a lagging indicator, so it will usually turn around about 6 months after the general economy. This puts the turnaround somewhere around January or February of 2010.

The Real Estate Market.
Out of the 45 panelist polled, 33 thought that the housing market will bottom in the next month or 2. The negative news is that Home prices will remain at a depressed level for at east another couple years, most experts believe.

Overall however, the economy looks to be getting stronger. The doom and gloom predictions are dying out, and a more optimistic view, like mine are taking hold. How do we know people are becoming more optimistic? The consumer confidence indicator jumped 14 points in the last month.

Tuesday, May 26, 2009

North Koreas Effect on the Economy


North Korea has been in the news quite a bit over this extended Holiday weekend here in the United States. Not only did they conduct an underground nuclear test over the weekend, but last evening they test fired 3 short range missiles, after the strong condemnation of the nuclear test by the world governments. So, What kind of economic impact will this have if any if things do continue to spin out of control, which probably won't happen?

Short Term the Dollar Will Rise, Gold will Rise in relation to other Currencies - The dollar is a safe haven when there are times of uncertainty in the rest of the world. Gold also is a great place to keep your money in uncertain political times, but the rise of the dollar may make Gold's rise a little less significant for us Americans.

Long Term The Dollar will Fall - If this thing gets drug out to where military action on our part was required, this means that there would be even more massive government spending, leading to even more national debt. Debt causes the dollar's power to decline in the long run

Stock Market
In my opinion this whole mess may give us all more time to invest at low prices. I highly doubt this will turn into an all out war, but even if it does, government spending is usually a plus for stock prices. If it doesn't progress much further, then stock prices remain depressed for a few extra weeks, and then shoot back up to where they would have been without a North Korea problem on our hands.

Conclusion:
Overall, I'd recommend not changing your investing strategy at all if you are investing in US securities. If you are an Japanese, or South Korean investing in their local markets, however, an investment strategy shift may be in order.