Showing posts with label bonds. Show all posts

Sunday, June 7, 2009

Mortgage Interest Rate History


Well It's Monday so I thought we'd do another chart here, as I love looking at charts filled with lots of good information. The chart/graph below shows the various types of mortgage rates for the last 17 years:


Mortgage Rate History
I'm concentrating on the Red and orange lines, which are the 30 year and 15 year fixed rate mortgage rates. If you just take a quick glance at them, you can clearly see that we are at the lowest rates, by far, in the last 17 years. In my opinion, if you can refinance your mortgage, this IS the time to do it. Don't wait. I personally feel this will be just about the lowest rates many will see in perhaps their lifetime. We are about 40% lower the the highs we saw in the early 1990's, and probably won't be going down any further from here.

Buy Outright, or Take a Mortgage?
Many people who have the cash to buy a home will buy the home outright. Sure, this will give you the piece of mind, knowing you owe nothing, and will likely never have a worry in the world about your home's affordability, however, it may not be the smartest move right now. If you can get a mortgage for 5%, it may be best to take it regardless if you can buy the home outright or not. Why? Inflation will likely go up quite a bit in the coming years. The FED will likely raise interest rates by quite a but over the next few years, meaning bank Certificates of deposits could possibly be paying an interest rate, in 2-3 years, higher then what you can take a mortgage out for today. f you can borrow $500,000 at 5% and get a CD or bond for 6%, you are making a cool $5000 a year profit. Just something to think about.

Conclusion

In my opinion, we have clearly struck a floor with interest rates, and anyone who hesitates on refinancing now, will likely regret it pretty soon.

Wednesday, June 3, 2009

Whats the Better Investment Now - Stocks or Bonds?


With the stock market up nearly 30% from it's lows only 3 months ago, many investors are speculating that it may now be time to consider investing in Bonds, which could pay off better then stocks int he long run. That's at least what some experts are saying. Me, on the other hand, disagree.


Bonds:
Bonds are still yielding extremely low rates of return compared to the past. The 10 year Treasury is paying just about 3.6%. That's not terrible, but you have to consider that inflation could easily reach 3.6% within the next year, and likely will go a bit higher than that. If inflation strikes like many experts think, we could see 10 year Treasuries paying over 6% easily, meaning those lowly 3.6% bonds you purchase today will be worth about 60% then. I, in fact, do like some of the more risky corporate bonds, where you can get a return as high as 10% on companies which really are not in that bad shape.

Stocks

Right Now, even though the market is up 30% from it's lows, I am still a stock guy. Although I do own some bonds, I believe that the stockmarket is the place to be. Why in the world would you buy a 3.6% Treasury bond that is locked in for 10 years, when you can buy a stock like Verizon (VZ) which has a 6.25% dividend, you can sell whenever you like, and will likely increase it's share price over the long run with or without inflation. If you are looking for the stable return of bonds, then buy some of the blue chip dividend stocks like Intel, BP, Pfizer, Bristol Myers Squibb, Altria, etc. You will get a pretty reliable stable return higher than 3.6% plus have the stock price gain to look forward to as well.

Conclusion:
Stocks are still an excellent buy. With the economy picking up finally, most dividend stocks which have yet to cut their dividends will likely be safe from here on out.

Tuesday, June 2, 2009

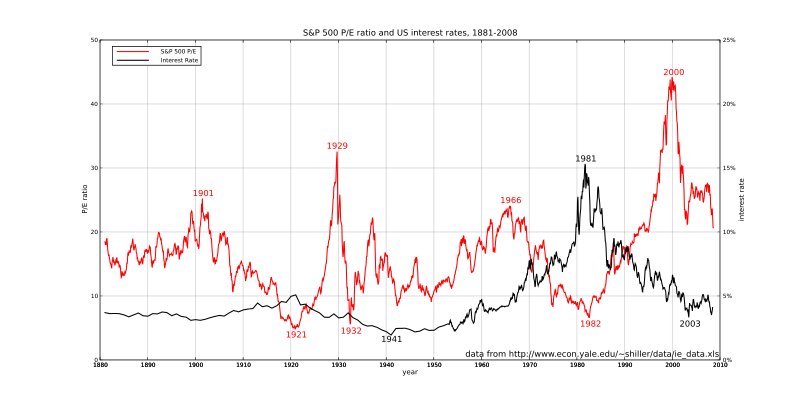
Historic PE Ratios Compared to Interest Rates


I don't have all that much news to bring to you all today so I thought I'd take a look at another chart. Below is graph of Interest rates vs the PE Ratios (Price to earning ratios of the S & P 500) over the last 120 years in the United States:


Like I said before I love looking at graphs and charts because they can tell you more than an entire 10 page essay could in just a few seconds. As you can see, we are currently at a pretty high average PE ratio, but having said this, it is so much lower then it was just a few years ago. You also must account for the fact that there is now optimism in growth, so a higher than average PE ratio is not all that bad. The current graph, however, leads me to believe that we may see a leveling off of the Dow at around 9000-9200, where it may stay and hover around for some time until better earning reports come out.

For those of you not familiar with PE ratios, it basically is the return a stock has over a year. If you have a PE ratio of 20, that means it will take the company 20 years to make a profit equal to it's current share price. Divide 100 by the PE ratio and you will get the rate of return the company is making. For instance 100/20 = 5, which means investing in the stock will provide a 5% annual return. Looking at the chart above you can see that in 1982, PE ratios were low, while interest rates were high. Is is because people could make a ton of interest just buying bonds, so why invest into stocks that have a yield lower then bonds do, at greater risk.

It should be interesting to see, how inflation could hamper the recovery of the US stock market should it go up by more then a few basis points.